Financial strength:
Sector: Technology Index: NDX Market cap: 51.86B
Income: 917.00M Sales: 5.27B P/E: 57.13
Business Description:
Autodesk, Inc. engages in the design of software and services. Its products include AutoCAD, BIM 360, Civil 3D, Fusion 360, InfraWorks, Inventor, Maya, PlanGrid, Revit, Shotgun, and 3ds Max.
The firm also offers product development and manufacturing software, which provides manufacturers in the automotive, transportation, industrial machinery, consumer products, and building product industries with comprehensive digital design, engineering, and production solutions.
Its architecture, engineering, and construction software improves the way buildings, factories, and infrastructure are designed, built, and used.
The firm is also involved in digital media and entertainment, which consists of tools for digital sculpting, modelling, animation, effects, rendering, and compositing for design visualization, visual effects, and game production.
The company was founded by John Walker in April 1982 and is headquartered in San Francisco, CA.
Historical Performance:


Financial Highlights: Third Quarter 2023:
Analyst expectations for Autodesk’s Q3 2023 revenue and earnings per share (EPS) were exceeded by 1.90% and 6.40% respectively.
Revenue projections are likely to experience an average annual growth of 9.2% over the next three years, in contrast to the industry-wide average in the US, which is forecasted to grow by 12%.
Over the last 3 years on average, earnings per share have fallen by 8% per year whereas the company’s share price has fallen by 9% per year.
Business Outlook
| Q4 FY24 (ending January 31, 2024) | |
| Revenue (in millions) | $1,422 – $1,437 |
| EPS GAAP | $0.99 – $1.05 |
| EPS non-GAAP(1) | $1.91 – $1.97 |
| FY24 (ending January 31, 2024) | |
| Billings (in millions)(2) | $5,075 – $5,175 (Down 12% – 11%) |
| Revenue (in millions)(3) | $5,450 – $5,465 (Up approx.. 9%) |
| GAAP operating margin | Approx. flat y/y |
| Non-GAAP operating margin(4) | Approx. flat y/y |
| EPS GAAP | $3.88 – $3.94 |
| EPS non-GAAP(5) | $7.42 – $7.49 |
| Free cash flow (in millions)(6) | $1,200 – $1,260 |
Autodesk. (November 21, 2023). Quarterly Results. “Third quarter fiscal 2024 earnings” Autodesk Investors. Retrieved January 17, 2024, from https://investors.autodesk.com/financials/quarterly-results
TECHNICAL OUTLOOK:
Recommendation: Buy
CMP: 242.44
Stop Loss: 185
Target: 340 – 350
Timeframe: 8 to 10 months
MONTHLY CHART:

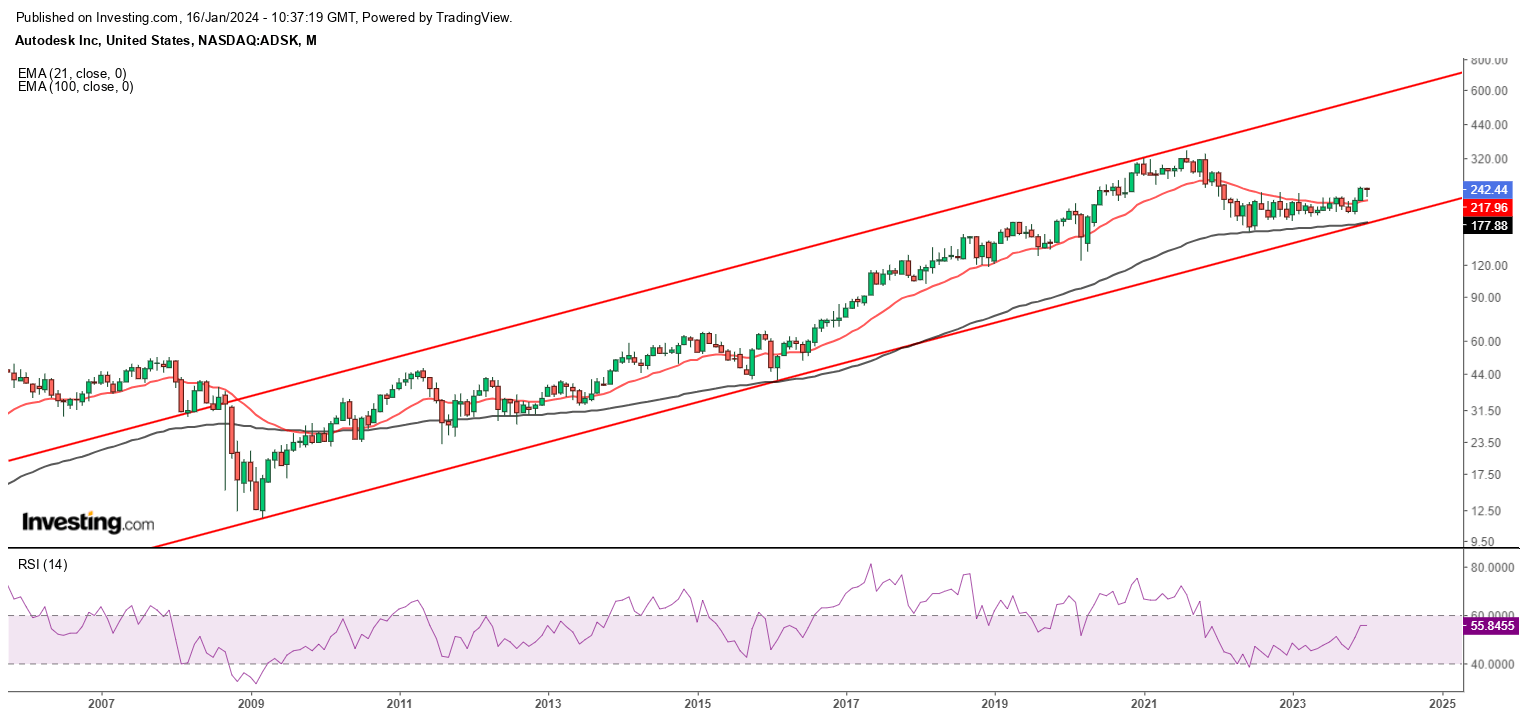
Price is in higher top higher bottom formation since bottom made in the year 2009. And since June 2022 stock is trading in a broader consolidation pattern and trading above lower band of the rising channel drawn in red.
WEEKLY CHART:

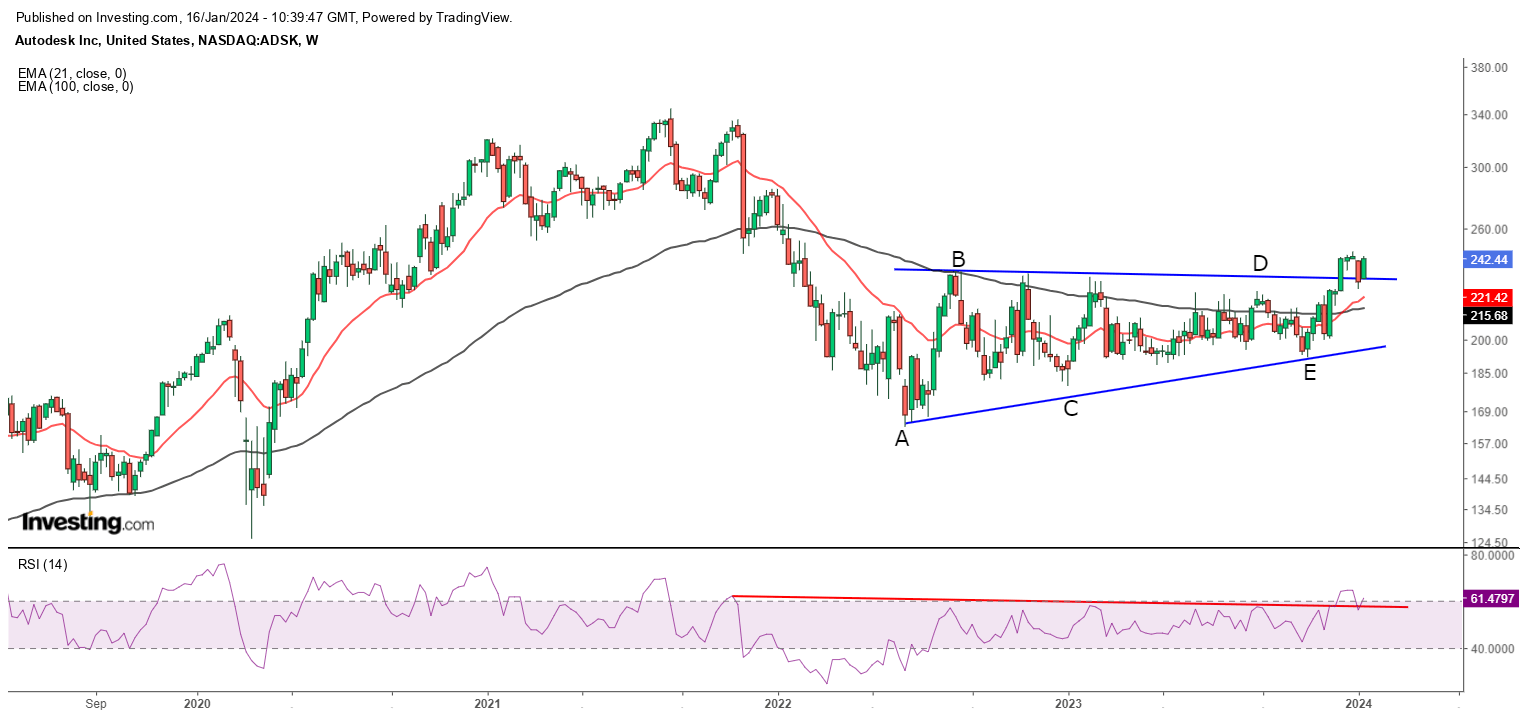
Going to the lower timeframe i.e. weekly chart, we can see that stock has undergone into broader consolidation in the form of triangle formation market with A-B-C-D-E. Few weeks back it has broken out of the resistance trend line of the triangle pattern (drawn in blue) and currently trading above it.
Momentum indicator “Relative Strength Index” – RSI is also witnessing build-up in momentum as it is trading above its previous swing tops (market with red line on the lower section of the chart). Which indicates that lower timeframe has entered positive momentum and going forward stock may see strong buying.
It is advised to create long position at current market price with stop loss at 185 and target on the higher side can be expected at 340 – 350 in coming 8 to 10 months.
Conclusion:
Autodesk’s Q3 earnings report shows a strong performance with noteworthy growth in revenue. Technically stock has started witnessing momentum build-up and trading above crucial trend line of 50-100-200 SMA.