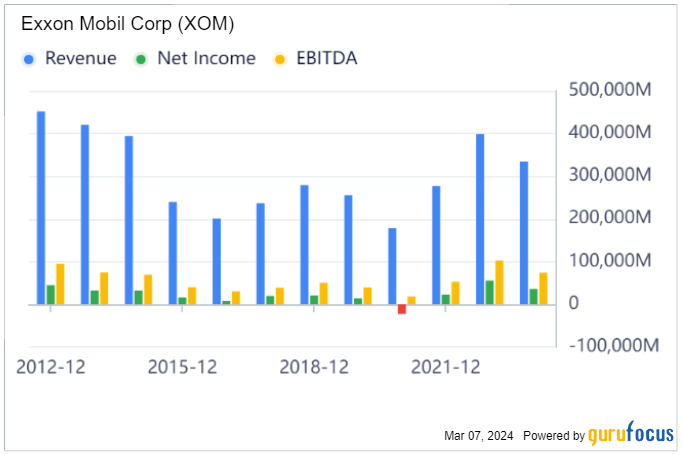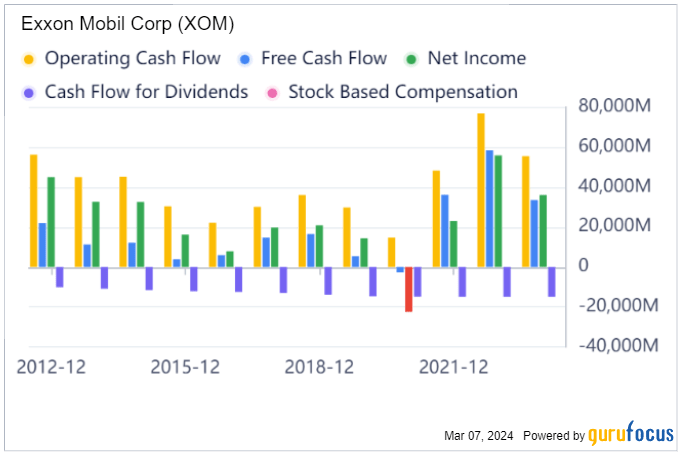
Financial Strength:

Business Description:
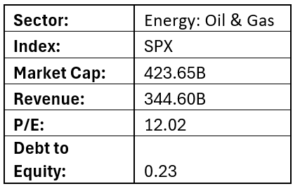
ExxonMobil operates as a comprehensive oil and gas enterprise engaged in exploration, production, and refining activities across the globe. In 2022, its daily output comprised 2.4 million barrels of liquids and 8.3 billion cubic feet of natural gas. By the close of 2022, its reserves amounted to 17.7 billion barrels of oil equivalent, with liquids accounting for 65% of the total. As the foremost refiner worldwide, the company possesses a combined refining capacity of 4.6 million barrels of oil per day and ranks among the leading producers of both basic and specialized chemicals globally.
ExxonMobil’s prominent stature within the energy sector, coupled with its historically proven integrated capital structure, has consistently delivered top-tier returns, rendering it a comparatively lower-risk investment within the energy industry. The company boasts a portfolio of highly productive upstream assets on a global scale. Additionally, it commands the largest refining operations worldwide, substantial chemical assets, and a dividend track record and credit profile that are unparalleled in the sector.
ExxonMobil’s rigorous capital spending discipline is a notable feature, with a focused allocation strategy aimed at key oil and gas projects. This approach sets it apart from many competitors, as the company remains committed to its traditional business model despite increasing pressure within the industry to address climate change by reducing carbon emissions.
The company organizes its operations into three primary segments: Upstream, Downstream, and Chemical, each contributing to its diversified business model and overall resilience in the market.
Historical Performance:


Financial Highlights: Fourth Quarter 2023:
Business Outlook

The Estimate Momentum analysis indicates changes in analyst sentiment over time, which can potentially forecast future price movements. Looking at the Change in Consensus chart for the fiscal quarter ending March 2024, the consensus earnings per share (EPS) forecast has remained constant over the past week at 2.22 but has decreased over the past month from 2.35 to 2.22, representing a decline of 5.53%. Among the three analysts providing quarterly forecasts, none have raised their estimates, and none have lowered them.
For the fiscal year ending December 2024, the consensus EPS forecast has stayed consistent over the past week at 9.15 but has decreased over the past month from 9.31 to 9.15, indicating a decline of 1.72%. Among the four analysts offering yearly forecasts, one has raised their estimate while three have lowered theirs.
TECHNICAL OUTLOOK:
Recommendation: Buy
CMP: 105.84
Stop Loss: 92
Target: 150 – 160
Timeframe: 3 to 4 months
WEEKLY CHART:

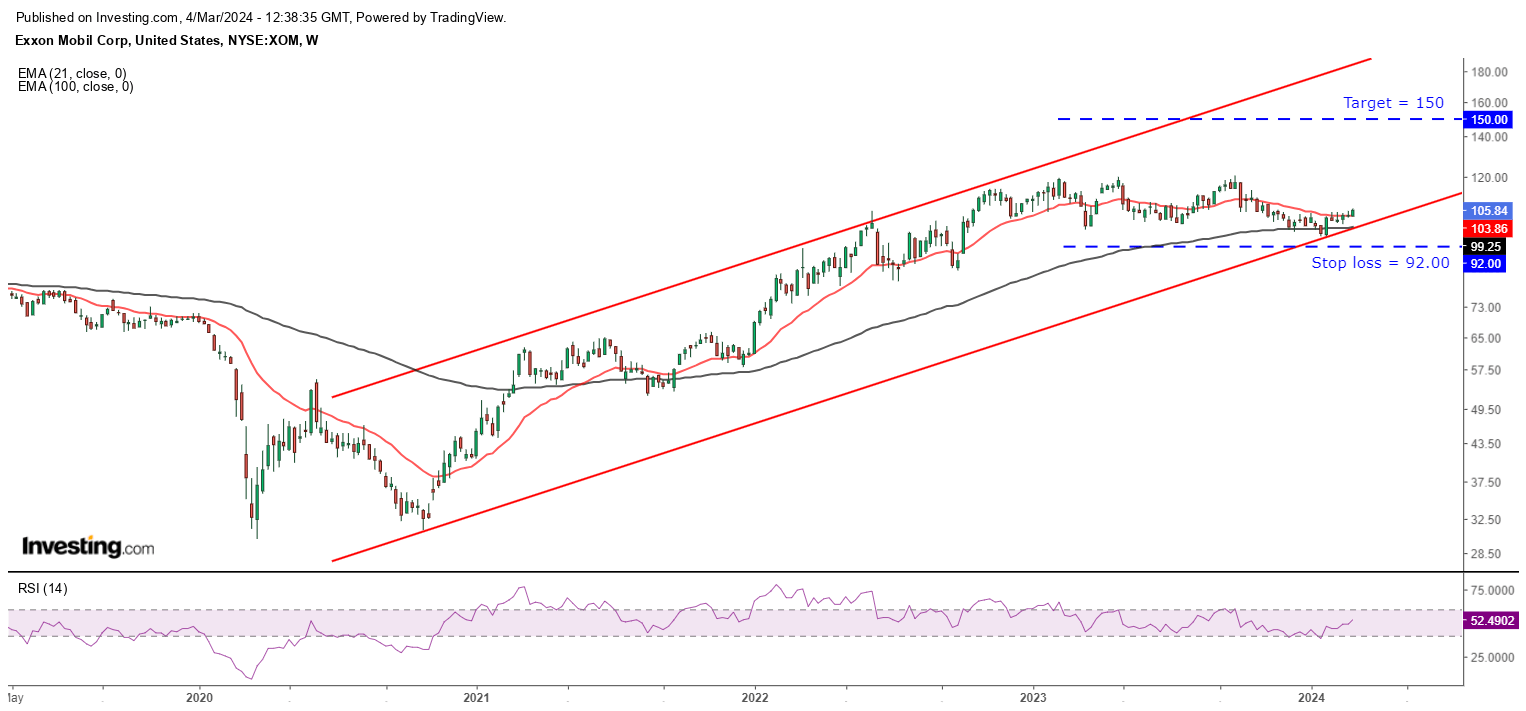
After analyzing the chart above, it can be observed that the stock is forming higher tops and higher bottoms. Recently, the stock has shown resilience in its price action after finding support above the lower band of the rising channel.
Furthermore, the current trading price of the stock is above both the short-term moving average (i.e., 21EMA) and long-term moving average (i.e., 100EMA). This implies that the stock price is expected to continue to increase in the upcoming months. This trend is also supported by the positive momentum that is building up, as the RSI momentum oscillator has been consistently above the 50-level on a weekly timeframe.
Consider purchasing at the current market price or on a small dip within the 105 – 100 range.
It is recommended to set a stop loss at 92.00.
In the next 3 to 4 months, the target on the higher side can be expected at levels between 150 and 160.